Table of Contents
How to Find an Anomalous Process and Capture Memory Bytes to a File on Linux?
Let's look into another example. Consider a Linux host is suspected to be compromised. You have been asked to inspect the machine. As a security analyst, it's your task to find a running anomalous process and capture the bytes from the memory to a file for further analysis.
For the demo, let's amuse htop as an anomalous process running background without the owner's permission.
Let's run htop command on the 1st terminal.
Now our task is to find the process and capture the bytes directly from the memory.
Identify the process to investigate
Let's see the process running on the terminal session.
psNo suspicious process is apparently running. Let's see the complete list of the process.
ps -eor
ps auxYou see an anomaly process running. Now, you want to investigate more about that specific process. In our case it's htop. You capture the process ID number of the process. You can directly capture the process ID number from the 'ps aux' command.
Alternatively, you can capture using 'pgrep' command if you know the name of the process.
pgrep htopThe next step should be to find the parent-child tree structure of the process. You can see that using the pstree command. Scroll up for more information about the command.
pstree command shows all the process including the process not running now but running in the past as a tree structure. You can add -g, -p, -a, -u flags for more detailed information.
If you want to display only the tree structure of a specific process, you can run the pstree command with the process ID number.
pstreepstree 13908 -g -p -a -uThis shows the process is running directly under systemd process. The command displays the process name, process ID of the process, group ID of the process, and the user who ran the process. Since in this case, the process is running directly underneath systemd, which is the parent of all processes, no parent is shown here.
How to Read the Process Tree Structure?
If you see the output of the pstree command it something looks like this. Systemd is the process parent of all the process. Apache2 is the child of systemd process running with the process ID 1204 and the group id 1204. Underneath that there is another apache2 process 1207, and several other apache2 process 1219, 1246, 1247, so forth.
If I want to see the process tree of the group ID 1204, I can do that with this command.
pstree 1204 -g -p -a -uCapture Bytes of the Running Process to a File
There is a special directory called proc underneath '/' directory. This holds all the information on running and previously run processes. If you list the files and directories of the proc directory. there you see a lot of sub-directories with numbers. These numbers are nothing but the process ID numbers. These are auto-created directories created when there a process is created with new process IDs. These directories contain processes that were running and ran in the past.
In this example, we should find the directory with the name '13908' underneath 'proc'.
ls /proc/13908Now you say, there is no htop process underneath this directory. Let's find the running processes in this list.
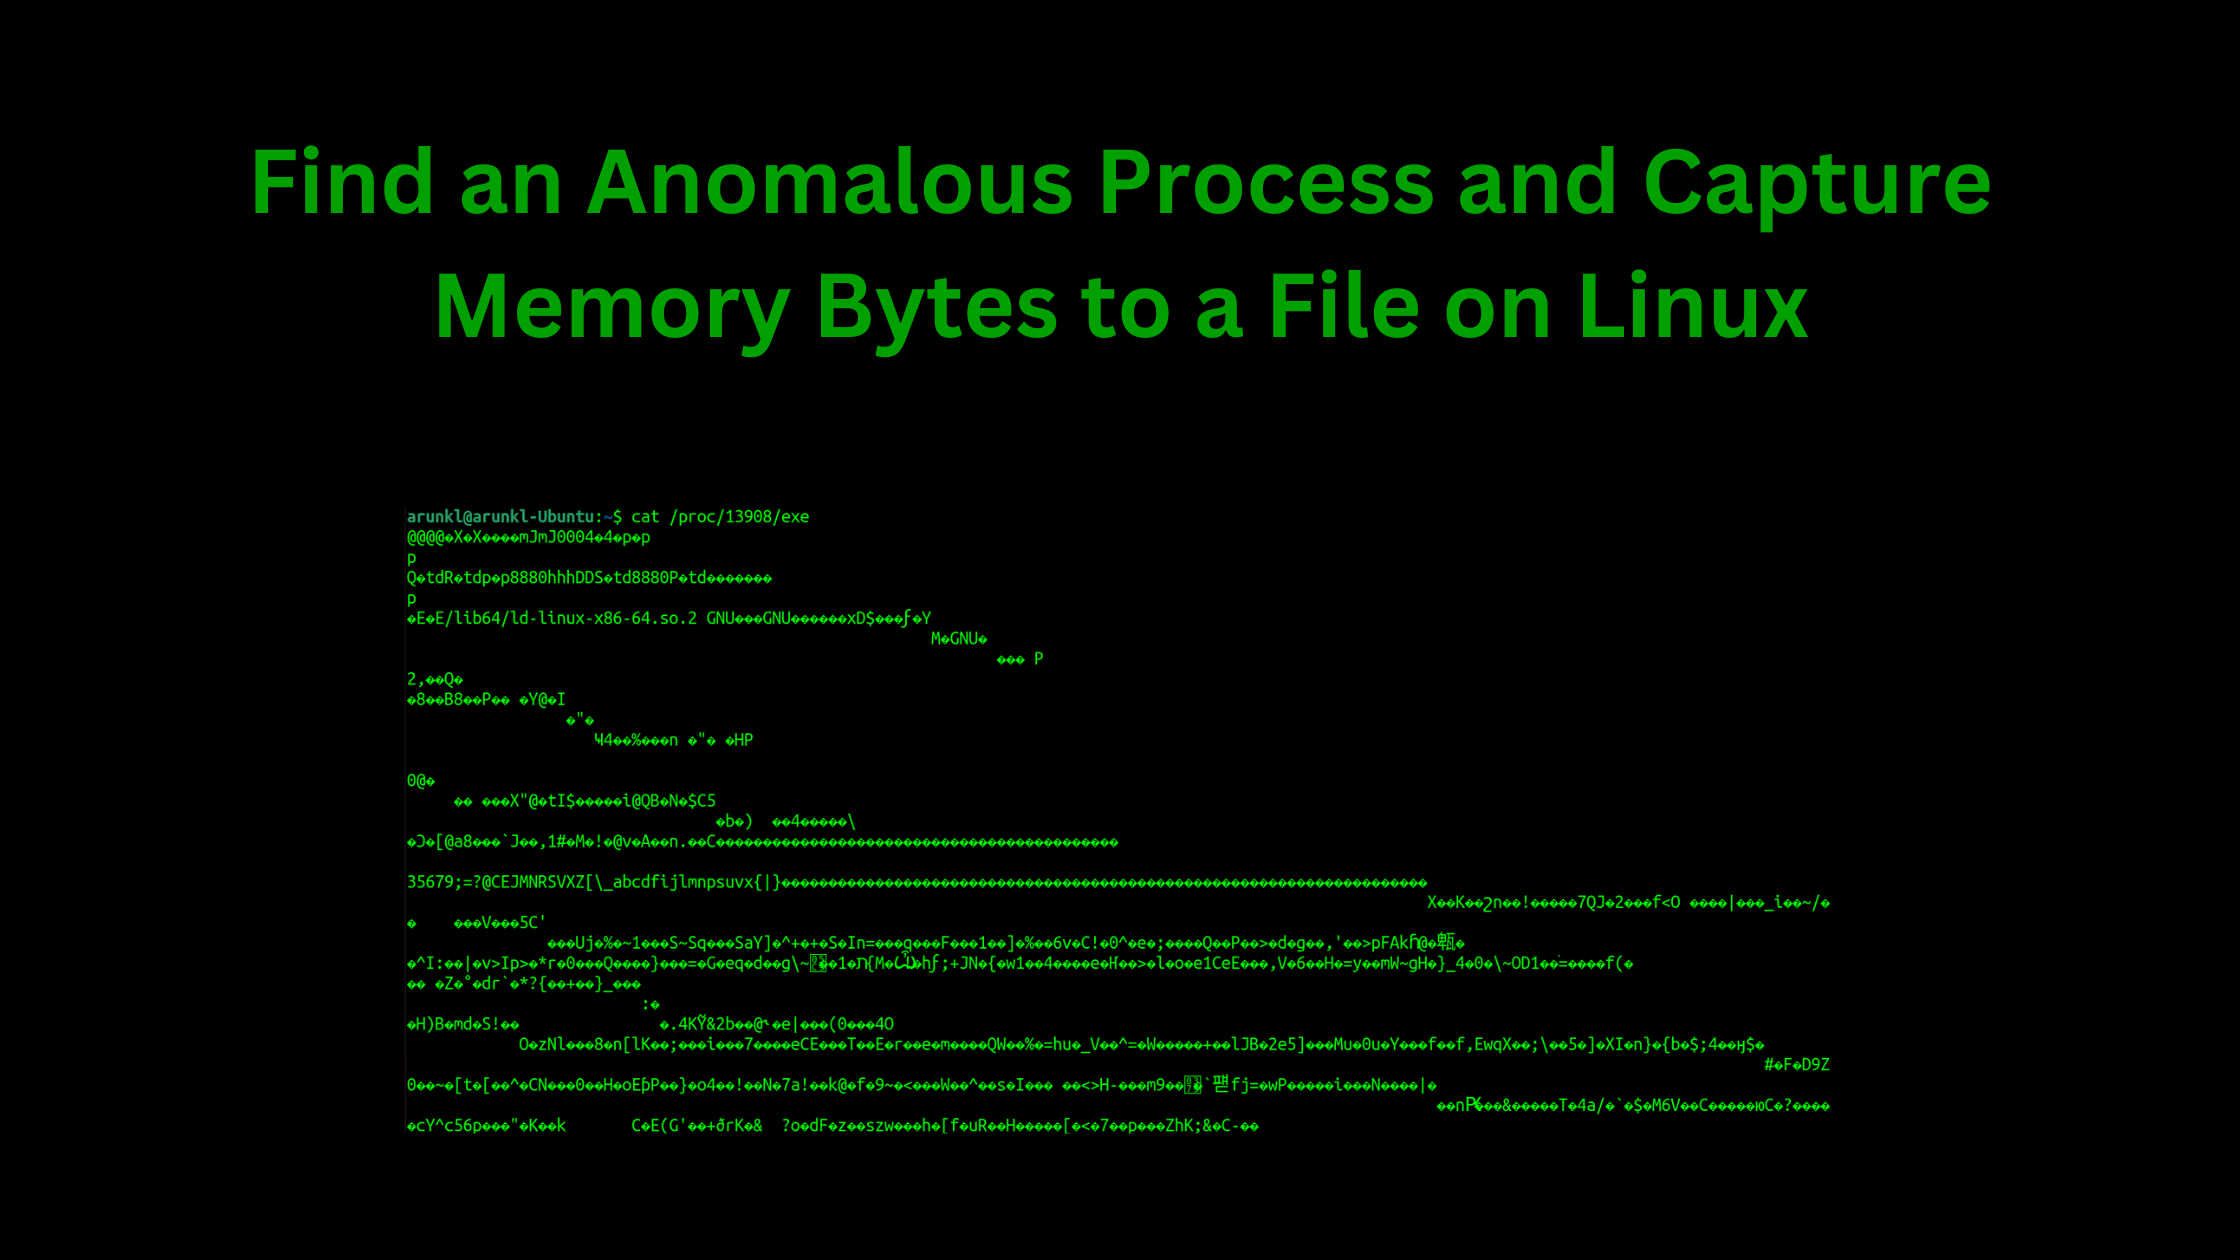
ls -l /proc/13908'exe' is the process that is running 'htop'. Now let's see the content of 'exe' with the help of cat command.
cat /proc/13908/exeAnyways, you can't completely read the content of memory. However, you can capture it as a file.
cat /proc/13908/exe >> /home/arunkl/htop_memorydumpI captured the memory dump of 'htop' to 'htop_memorydump' file in my home directory.
You can see the content of the file or even execute it.
cat /home/arunkl/htop_memorydumpTo execute it.
chmod +x htop_memorydump
./htop_memorydump
As soon as you run the 'htop_memorydump' file you should see the htop output, which shows the list of all running processes.
Two htop processes are running on the screen. the first one is 13908 which is the old process running, and the second one is with process ID 14305 with the name 'htop_memorydump'.
You can use the 'htop_memorydump' file for further analysis. You can repeat the same process to identify the parent-child processes and further analyze them. That's it.
We hope this post served as a good source of information to know how to find an anomalous process and capture memory bytes to a file on Linux. Visit our website, thesecmaster.com, and social media pages on Facebook, LinkedIn, Twitter, Telegram, Tumblr, & Medium and subscribe to receive updates like this.
You may also like these articles:
Arun KL
Arun KL is a cybersecurity professional with 15+ years of experience in IT infrastructure, cloud security, vulnerability management, Penetration Testing, security operations, and incident response. He is adept at designing and implementing robust security solutions to safeguard systems and data. Arun holds multiple industry certifications including CCNA, CCNA Security, RHCE, CEH, and AWS Security.
